Vrbo tiene presencia global y más de 2 millones de anuncios activos. Es una plataforma popular para alquileres vacacionales. Sin embargo, muchas otras plataformas de agencias de viajes online (OTA) también te conectan con viajeros que buscan alojamiento. Por lo tanto, ¿qué alternativas a Vrbo deberías considerar? Además, ¿cómo elegir la plataforma adecuada para llegar a un público más amplio y conseguir más reservas?
Analicemos las ventajas y desventajas de las alternativas a Vrbo, como Airbnb y Booking.com. Esto te ayudará a tomar decisiones informadas.
Si busca una forma sencilla de optimizar sus operaciones en Airbnb, considere usar Hostex — automatiza más de 70% de tareas diarias de alquiler a corto plazo por solo $4.9/mes, lo que le da más tiempo para concentrarse en lo que más importa.

¿Por qué necesitas alternativas a Vrbo?
Según AirDNA, más del 70% de anfitriones profesionales ahora publican propiedades en múltiples plataformas.
Estos anfitriones alcanzan una tasa de ocupación promedio de 58,31 TP3T, significativamente superior a la de quienes utilizan una sola plataforma. Esto revela la lógica fundamental de las operaciones modernas de alquiler a corto plazo:
Diversificar riesgos + Orientar a audiencias específicas = Maximizar ingresos.
1. Libérese de la dependencia excesiva de una única plataforma
Las distintas plataformas varían considerablemente en volumen de tráfico, comisiones, algoritmos de búsqueda y políticas de protección del host. Por lo tanto, los hosts que dependen únicamente de un canal están completamente sujetos a las normas de la plataforma. Esto representa un riesgo comercial significativo.
2. Superar el sesgo oculto algorítmico de Vrbo
Los nuevos anuncios de Vrbo tardan un promedio de 90 días en aparecer en los grupos de recomendaciones de búsqueda. Mientras tanto, el periodo de inicio en frío de Airbnb para los nuevos anuncios solo requiere 45 días.
A $200 por noche, este algoritmo podría costar a los nuevos anfitriones $8,400 en ingresos potenciales durante los primeros tres meses.
Además, el algoritmo perjudica a los pequeños proveedores. En comparación con las grandes empresas de administración de propiedades, estos aparecen sistemáticamente en posiciones más bajas en los resultados de búsqueda.
3. Llegar a grupos de clientes más amplios
El estudio de consumidores de Expedia Group de 2025 muestra que el 721% de los usuarios de Vrbo son familias que viajan en Norteamérica. Sin embargo, la plataforma cubre menos del 201% de estos grupos de alto valor:
- Viajeros de negocios (gasto diario $280+)
- Nómadas digitales (estancia media de 14+ días)
- Estudiantes internacionales (demanda estable fuera de temporada)
- Jóvenes adultos sin hijos (más tiempo de vacaciones)
Estar presente en más plataformas ayuda a ampliar tu audiencia; en otras palabras, cada plataforma atrae a diferentes grupos demográficos de usuarios.
4. Optimizar dinámicamente los ingresos
Los datos prácticos de Pricelabs muestran que los hosts que utilizan tres o más plataformas aumentan el RevPAR anual en 22%.
Por ejemplo, una plataforma que cobra comisiones de 181 TP3T (31 TP3T más que Vrbo) convierte a 291 TP3T más viajeros de negocios. Esto se traduce en un ROI 121 TP3T más alto, lo que significa mayores ganancias para usted.
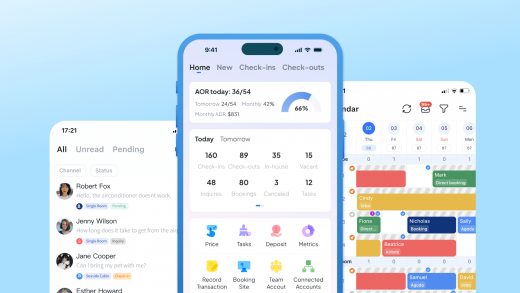
Con herramientas como Hostex, gestionar múltiples plataformas es muy sencillo. En concreto, su calendario unificado sincroniza automáticamente todos los anuncios, lo que garantiza que te mantengas organizado y actualizado.

¿Cómo elegir la alternativa adecuada a Vrbo?
A continuación se muestra una comparación de las principales plataformas de alquiler a corto plazo, basada en informes de la industria y datos de plataformas públicas:
| Plataforma | Público objetivo | Regiones primarias | Cuota de mercado (Regiones clave) | Comisión promedio | Ventajas clave | Desventajas clave |
| Vrbo | Viajeros familiares (72%) | América del Norte, Europa | 18% (mercado no hotelero de EE. UU.) | 15%+ | Filtros avanzados para familias | Largo período de arranque en frío (más de 90 días) |
| Airbnb | Millennials (83%) | Global (enfoque en EE. UU. y la UE) | 9.57% (global no hotelero) | 15% | Alta calidad de marca, complementos de experiencia | Volatilidad del tráfico posterior al Superhost |
| Reservas.com | Viajeros de negocios (67%) | Europa, Asia-Pacífico | 55% (OTA global) | 18% | Reserva instantánea, alcance internacional | Listados homogéneos, competencia de precios |
| Expedia | Usuarios de paquetes de ofertas | América del Norte, América Latina | 70% (OTA de hotel de EE. UU.) | 20%+ | Tráfico de paquetes de aerolíneas, herramientas corporativas | Mala experiencia móvil |
| Agoda | Viajeros de Asia-Pacífico (91%) | Sudeste Asiático, Japón y SK | 9.8% (Sudeste Asiático) | 20% | Pagos localizados (Alipay/WeChat) | Optimización débil para dispositivos móviles de China |
| Hoofy | Anfitriones expertos en tecnología | América del Norte, Europa Occidental | N / A | 0% | Cero comisiones, integrable en sitios web | SEO autodirigido (barrera técnica) |
| Directo Sitio web de reservas | Huéspedes leales/de lujo | Depende de la estrategia | N / A | 0% | Control total de precios y datos | CAC alto ($50/plomo) |
Análisis de la plataforma Airbnb
1. Perfil del cliente
- Alcance global:Más de mil millones de usuarios en todo el mundo, con 60% de Europa y América del Norte.
- Enfoque en la edad:58% son viajeros jóvenes de entre 18 y 35 años.
- Rasgos clave:
- Alto poder adquisitivoPrefieren viajar por su cuenta y la inmersión cultural. Dos tercios reservan viajes al menos tres veces al año.
- Diversidad internacionalLos usuarios angloparlantes predominan, pero la demanda de Asia-Pacífico y América Latina crece rápidamente.
- Experto en tecnología:93% utiliza dispositivos móviles (principalmente iOS), favoreciendo las integraciones de hogares inteligentes.
2. Posición en el mercado
- Dominio global:Opera en más de 220 países/regiones y posee el 9,57% del mercado global de alquileres a corto plazo.
- América del norte:18% de listados globales, máxima densidad.
- Europa: Abarca 671 TP3T de viajeros de negocios. París y Londres registran una penetración de mercado de más de 301 TP3T.
- Asia-Pacífico:Región de más rápido crecimiento (crecimiento anual de 22%), impulsada por Japón y el Sudeste Asiático.
- Enfoque en los ingresos:47% de los ingresos totales provienen de EE.UU.
3. Ventajas principales
- Flexibilidad operativa:Los anfitriones establecen libremente las fechas de disponibilidad y las estadías máximas (por ejemplo, límites de 30 días) para evitar las leyes de protección de los inquilinos.
- El tráfico mundial equilibra la demanda estacional:Verano en Occidente y vacaciones del Año Nuevo Lunar/APAC.
- Base de huéspedes diversa: Millennials (83%), viajeros de negocios ($280+ gasto diario) y turistas internacionales (crecimiento de 22% en APAC).
- Sistema de revisión bidireccional:Filtra huéspedes de calidad. El 95% de las disputas se resuelven a través del soporte de Airbnb, priorizando la protección del anfitrión.
- Oportunidades de venta adicionalLos anfitriones ofrecen senderismo, clases de cocina, etc., con una cuota de actividades de 201 TP3T. Crecimiento anual: 451 TP3T.
4. Riesgos y desafíos clave
- Presiones de costos:Las tarifas de servicios de alojamiento (10-15%) y las tarifas de pago regionales (3,5% en APAC) reducen las ganancias.
- Riesgos de daños a la propiedadIncidentes ocasionales en fiestas (p. ej., suelos manchados, muebles rotos). El seguro AirCover solo cubre daños básicos.
- Obstáculos regulatorios:Prohibiciones locales sobre alquileres a corto plazo o altos costos de cumplimiento (por ejemplo, el impuesto sobre alquileres a corto plazo 15% de la UE).
- intensa competenciaMás de 6 millones de anuncios en todo el mundo. Los nuevos anfitriones se enfrentan a periodos de inicio en frío de 45 días y a costes de tráfico 29% más elevados que Booking.

Reservas.com Análisis de la plataforma
1. Perfil del cliente
- Datos demográficos de los usuariosEl 671% de los usuarios tienen entre 25 y 45 años, de los cuales 421 son viajeros de negocios y 351 son familias. La mayoría prefiere hoteles de gama media-alta, aunque la demanda de alquileres vacacionales está en aumento.
- Enfoque regional:
- Mercados principales:América del Norte y Europa dominan (62% búsquedas localizadas).
- Áreas de crecimientoLas reservas en Asia-Pacífico aumentaron 48% anualmente, impulsadas por el Sudeste Asiático.
2. Posición en el mercado
- Alcance global:Opera en más de 220 países con más de 6 millones de hoteles y alquileres.
- Acciones regionales:Europa (55%), América del Norte (22%), Asia-Pacífico (15%).
- Dominio de la industriaLidera las OTA globales con 70% de reservas de hotel y 12% de alquileres vacacionales (con un crecimiento de 27% al año).
3. Ventajas principales
- Tecnología y eficiencia:
- 98% de listados ofrecen reserva instantánea, lo que aumenta las conversiones en un 19% en comparación con la competencia.
- Admite más de 40 idiomas, con tasas de conversión de usuarios que no sean inglés de 63%.
- Competitividad de precios:
- Iguala los precios más bajos (hasta $50 de reembolso por discrepancias).
- 70% de los listados permiten cancelaciones gratuitas entre 24 y 72 horas antes de la llegada.
- Confianza y lealtad:
- 58% de usuarios reservan 3 o más viajes al año.
- Más de 120 millones de reseñas verificadas con una precisión de detección de reseñas falsas del 99,2%.
- Ecosistema integración:
- 47% Ingresos no relacionados con estancias de vuelos, alquileres de coches y actividades.
- Las asociaciones con Marriott, Hilton, etc., permiten beneficios de fidelidad compartidos.
4. Riesgos y desafíos clave
- Limitaciones del alquiler vacacional:
- Sólo 12% de alquileres vacacionales y carecen de propiedades únicas (por ejemplo, casas en los árboles).
- La audiencia centrada en la familia (35%) muestra una baja demanda de listados de nicho.
- Brechas de diversidad de usuarios:
- 67% de usuarios de entre 25 y 45 años; lucha por atraer a la Generación Z (18-24).
- Dependencia excesiva de Europa (participación del 55%); baja penetración en América Latina y África (<10%).
- Presiones de costos:
- Las comisiones de alquileres vacacionales de 18% superan a Vrbo (15%) y Airbnb (13-15%).
- Los altos costos de comercialización (45% de gastos) reducen las ganancias.
- Sesgo del algoritmo:Subexpone listados en destinos con poco tráfico, lo que desalienta las asociaciones con anfitriones.

Análisis de la plataforma Expedia
1. Perfil del cliente
- Datos demográficos de los usuariosSe dirige principalmente a personas de 25 a 45 años con un gasto diario de $280 o más. Las propiedades de alta gama alcanzan un RevPAR 23% superior al promedio del mercado.
- Enfoque regional:
- dominio estadounidense:Aporta 60%+ en ingresos, con una recuperación más rápida en noches de hotel.
- Crecimiento de Asia-Pacífico:La demanda está aumentando, pero la penetración del mercado está por detrás de la de Estados Unidos y Europa.
- Rasgos de comportamiento:
- Reservas de última hora:68% de las reservas se realizan dentro de los 7 días previos al viaje. 89% utilizan dispositivos móviles.
- Sensibilidad al precio:El modelo de “reserva opaca” (por ejemplo, Hotwire) ofrece tarifas con descuento para atraer a usuarios conscientes de su presupuesto.
2. Posición en el mercado
- Alcance global:
- 36% de cuota de mercado de OTA, con $110.9B de reservas totales en 2024. 88% de ingresos por alojamiento.
- Abarca más de 220 países. Entre las marcas se incluyen Expedia, Hotels.com y Vrbo. Se añadieron 1 millón de apartamentos urbanos en el cuarto trimestre de 2024.
- Desempeño financiero:
- Beneficio neto de 2024: 1.234 millones de TP4T. EBITDA ajustado: 2.934 millones de TP4T. Las noches de hotel se recuperaron a 831 TP3T respecto a los niveles de 2019.
- Desglose de segmentos:
- Reservas de aerolíneas (4% de ingresos, 3% de comisiones).
- Alojamiento (70% ingresos, 15% comisiones).
- Los alquileres vacacionales (Vrbo) crecieron 27% interanual.
3. Ventajas principales
- Sinergia multimarcaIntegra Expedia, Hotels.com y Vrbo en un ecosistema de viajes completo. Los puntos de fidelidad entre marcas impulsan las reservas recurrentes.
- Control de la cadena de suministro:
- Contratos directos con 880.000 hoteles y 2 millones de alquileres vacacionales. La estrategia de inventario de bajo precio durante la pandemia aseguró participación de mercado.
- Los ingresos de Egencia (viajes corporativos) aumentaron 21% en 2024.
- Estrategias de contenido y tráfico:
- Lanzado “Tiendas de viajes” (asociaciones con creadores de videos), lo que aumenta las conversiones en 12%.
- Programa de fidelización One Key y los descuentos para nuevos usuarios (por ejemplo, los cupones $15) impulsaron las descargas de la aplicación.
4. Riesgos y desafíos clave
- Fragmentación de marcaLos sistemas multimarca heredados causaban ineficiencias (por ejemplo, Vrbo carecía de integración con el sistema de fidelización). El backend unificado de 2023 mejoró, pero no solucionó los problemas por completo.
- Competencia externaAirbnb domina el mercado de alquileres vacacionales de alta gama. La cuota de mercado global de Booking, de 191 TP3T, eclipsa la de Expedia, de 121 TP3T.
- Costos regulatorios:El impuesto de alquiler a corto plazo 15% de la UE y las variaciones de los impuestos estatales de EE. UU. aumentaron los costos. Los gastos de impuestos de 2024 aumentaron 23% interanual.

Análisis de la plataforma Agoda
1. Perfil del cliente
- Datos demográficos de los usuariosUn ligero aumento de usuarias (impulsado por campañas en redes sociales). El gasto diario oscila entre 150 y 300 dólares, con preferencia por hoteles económicos y estancias únicas (p. ej., casas en los árboles o apartamentos en la ciudad).
- Enfoque regional:
- Asia-Pacífico centroTráfico 60%+ desde China, Japón y Corea del Sur. Principales destinos: Tailandia, Singapur y Hong Kong.
- Mercados secundarios:30% de usuarios en EE. UU./Europa, principalmente viajeros de negocios y mochileros.
- Rasgos de comportamiento:
- Sensible al precio:78% utiliza alertas de precios; 65% compara precios a través de Google Maps antes de reservar.
- Primero los dispositivos móviles:89% reservas mediante aplicaciones móviles.
2. Posición en el mercado
- Participación globalPosee una cuota de mercado de 121 TP3T, superada por Booking (361 TP3T) y Expedia (241 TP3T). **Sin embargo**, lidera en Asia-Pacífico con una cuota de mercado de 281 TP3T.
- Escala de inventario:Más de 2,9 millones de anuncios globales, 45% en Asia-Pacífico (incluidos 100.000 apartamentos en la ciudad).
- Sinergia grupal:Parte de Booking Holdings, comparte recursos tecnológicos con Booking.com y Kayak, pero opera de forma independiente para evitar la superposición de marcas.
3. Ventajas principales
- Experiencia de usuario simplificada:La interfaz de la aplicación optimizada redujo los pasos, lo que aumentó la retención de la Generación Z en 12%.
- Dominio de la búsqueda:Integra las comparaciones de precios de Google Maps, priorizando los listados con botones “Reservar ahora”.
- Programas de fidelización:El canje de puntos y las actualizaciones gratuitas aumentan las reservas repetidas.
- Apoyo financiero:Se lanzó una plataforma de financiación colectiva para listados premium, que ofrece capital y mejoras de marca.
4. Riesgos y desafíos clave
- cargos ocultos:La conversión automática de moneda (por ejemplo, tarifa de 5% en pedidos de $2000) infla los costos.
- Pagado riesgos del modelo:Las reservas garantizadas bloquean los ingresos, pero exponen a los anfitriones a caídas de ingresos del 25% durante el exceso de oferta.
- Salidas engorrosas:Requiere revisiones de documentación de 30 días; algunos anfitriones informan cargos posteriores a la terminación.
- Sesgo del consumidor:Las resoluciones de disputas favorecen a los huéspedes, dejando a los anfitriones sin compensación por daños a la propiedad.

Recomendaciones definitivas de alternativas a Vrbo
En función de las principales ventajas y los problemas operativos de cada plataforma, aquí se presentan sugerencias específicas para los anfitriones:
- Vrbo: Ideal para anfitriones que buscan viajeros familiares con alquileres de casas completas (villas/fincas) o propiedades con temática cultural (por ejemplo, diseño vintage, estadías en granjas).
- Airbnb: Adecuado para anfitriones globales que ofrecen experiencias únicas y propiedades distintivas.
- Booking.com: Ideal para anfitriones de Airbnb de alojamientos orientados a negocios (por ejemplo, apartamentos en la ciudad, propiedades junto al aeropuerto) que buscan reservas inmediatas y altas tasas de conversión.
- Expedia: Ideal para que los anfitriones complementen los recursos de hoteles y aerolíneas de alta gama con ofertas como complejos turísticos y apartamentos de estadías prolongadas.
- Agoda: Perfecto para anfitriones que apuntan al mercado de Asia-Pacífico (Japón, Corea, Sudeste Asiático) y que dependen de clientes sensibles al precio, especialmente hoteles económicos y pensiones urbanas.
- Houfy: Ideal para anfitriones expertos en tecnología o propietarios de pequeños Airbnb que buscan autonomía operativa completa.
Sitio web de reserva directa: una mejor alternativa a Vrbo
En lugar de depender únicamente de los canales de distribución de las OTA, los anfitriones de Airbnb pueden crear su propio sitio web de reservas directas. Esto les permite conectar directamente con los huéspedes y controlar todos los aspectos de sus operaciones.
Este enfoque no solo elimina los costos de comisión, sino que también permite el crecimiento de los ingresos a largo plazo a través de la marca.
- Sin tarifas de plataforma:Evite deducciones como el 15% de Airbnb o el 18% de Booking.com. El 100% de las reservas se hospedan con usted.
- Sea dueño de sus clientes: Monitorea internamente correos electrónicos, preferencias e historial de reservas. Envía ofertas personalizadas para impulsar las compras recurrentes en más de 30%.
- Reglas que funcionan para ti: Establezca requisitos de estadía mínima o términos de cancelación flexibles sin restricciones de plataforma.
- Evite los riesgos del algoritmo:No es necesario cumplir con la regla de publicación de 90 días de Vrbo ni con los criterios de SuperAnfitrión de Airbnb.
Puedes utilizar Hostex Creador de sitios web de reservas para crear su sitio web de reserva directa con un solo clic, sin código y sin coste.
Además, publicar su anuncios en Google Vacation Rentals Puede ayudarle a ganar más tráfico.

Tácticas de gestión multiplataforma
Por supuesto, puedes elegir Anuncie su propiedad en múltiples canales OTA Al mismo tiempo, gestiona su propio sitio web de reservas directas. Este enfoque puede ayudarle a maximizar el tráfico y aumentar su potencial de reservas.
No hay necesidad de preocuparse por un aumento de la carga de trabajo. De hecho, herramientas como Hostex Para alquileres a corto plazo, puede ayudarle a gestionar todos los anuncios de la plataforma en un solo calendario. Además, sus funciones de automatización gestionan más de 70% de tareas diarias, lo que le permite centrarse en otros aspectos importantes de su negocio.
- Sincronización en tiempo real: Alinea calendarios, precios e inventario entre las OTA y tu sitio web. Elimina las reservas duplicadas y los errores causados por ajustes manuales.
- Mensajes automáticos: Admite respuestas automatizadas a consultas de huéspedes, mensajes automatizados basados en activadores y envío/respuesta automática a reseñas, lo que agiliza la comunicación y la interacción con los huéspedes.
- Precios dinámicos: Integración con herramientas como Pricelabs para ajustar dinámicamente las tarifas según las condiciones del mercado local.
- Monitoreo de métricas: Genere informes categorizados por diferentes dimensiones, lo que le permitirá ajustar estrategias para plataformas de bajo rendimiento.
Hostex Le permite optimizar la gestión de alquileres a corto plazo con un conjunto completo de herramientas. Minimice la carga de trabajo manual y consiga operaciones eficientes de "descanso y trabajo" con mínima supervisión, desde tan solo $4.9 al mes.


