
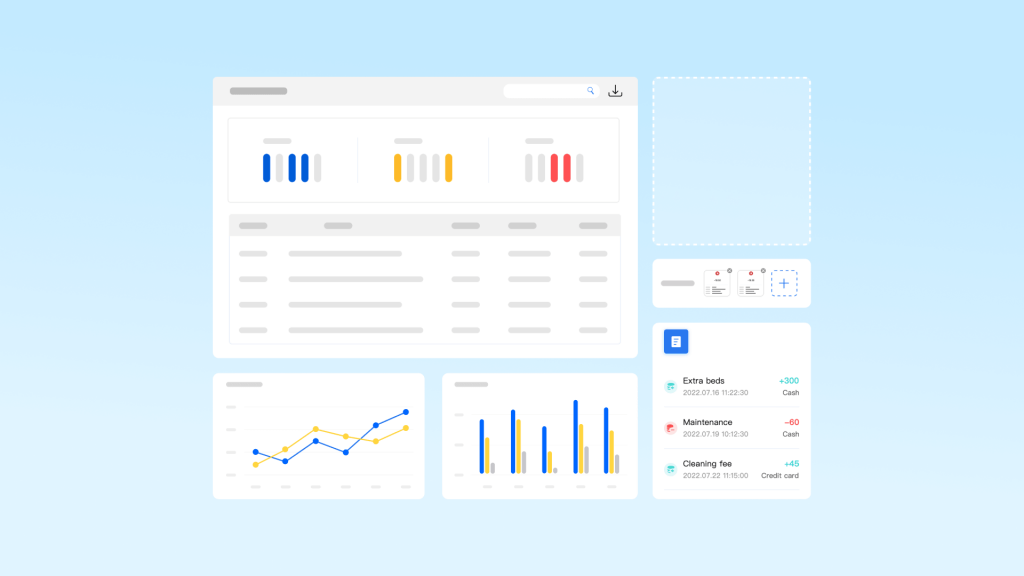
An Airbnb can appear successful while quietly losing money. Vacation rental reporting helps you see beyond revenue to understand how your property is really performing. By connecting occupancy, ADR, and RevPAR with booking channels, expenses, and owner payouts, the right reports reveal what’s working, where costs are rising, and what needs attention.
This guide covers the essential reports, what they tell you, how to interpret the numbers, and how to turn booking and financial data into better management decisions.
What Is Vacation Rental Reporting?
Vacation rental reporting is the process of organizing booking, revenue, expense, and property data into reports that show how the business is performing.
A useful reporting system answers three questions:
- What happened? Revenue, bookings, occupancy, expenses, and payouts.
- Why did it happen? Changes in pricing, channels, stay length, demand, or operating costs.
- What should I do next? Adjust rates, review a channel, cut costs, or investigate an underperforming property.
For example, a higher ADR may seem like a positive result. But if occupancy falls at the same time, the property may actually generate less revenue overall. Looking at ADR alone would miss that change. Comparing ADR, occupancy, and RevPAR together gives you a much clearer picture of whether a pricing change actually improved performance.
The Essential Vacation Rental Reports to Track
No single report tells you whether a rental is performing well. Different reports answer different questions, and the most useful setup connects them.
Most hosts should start with five categories: occupancy and revenue performance, channel performance, booking and stay patterns, income and expense, and owner statements. The exact reports depend on your TPM, OTAs, and business model.
1. Occupancy and Revenue Performance
This is usually the first report to review because it shows how effectively your available nights turn into revenue.
Key metrics:
- Taxa de ocupação: percentage of available nights that were booked
- ADR (Taxa Média Diária): average rental revenue per booked night
- RevPAR (Revenue per Available Room): rental revenue per available night
- Booked nights: total nights sold during the period
- Available nights: nights that could have been booked
- Revenue: rental revenue generated during the period
Formulas:
- Occupancy Rate = Booked Nights ÷ Available Nights × 100
- ADR = Rental Revenue ÷ Booked Nights
- RevPAR = Rental Revenue ÷ Available Nights
These answer different questions. A high ADR can still hide underperformance when too many nights sit empty. Conversely, high occupancy doesn’t prove you’re pricing well if you’re filling the calendar at needlessly low rates.
How to use it: Don’t ask only whether occupancy or ADR went up. Watch how they move together and compare against previous periods. If ADR rises while occupancy falls sharply, check whether pricing is suppressing demand. If occupancy rises while ADR falls, check whether you’re buying occupancy with discounts.
2. Channel Performance
If you accept bookings from Airbnb, Vrbo, Booking.com, a direct booking site, or other channels, your total revenue won’t tell you which channel is actually performing.
A channel report breaks results down by booking source. Depending on the system, it may include:
- Reservas
- Booked nights
- Revenue
- ADR
- Occupancy
- Taxas de plataforma
- Net revenue or payout
- Taxa de cancelamento
The point isn’t to find the channel with the most bookings. It’s to see what each channel contributes after its costs. Channel A might generate more bookings than Channel B, but if A has higher fees or produces shorter stays with more turnovers, its contribution may be less attractive.
Observação: A platform’s earnings dashboard may define revenue before certain fees, so numbers from different systems aren’t interchangeable. Airbnb, for example, distinguishes total nightly revenue from income and completed or upcoming payouts.
How to use it: Compare channels with consistent definitions and time periods. Ask which channels bring valuable bookings at an acceptable cost. The answer tells you where to focus distribution, whether a channel deserves more inventory, and whether more direct bookings would improve your channel mix.
3. Booking and Stay-Pattern Report
Revenue and occupancy tell you what happened. Booking data helps explain how.
Useful metrics include:
- Check-ins and check-outs
- Average length of stay
- Booking lead time
- Taxa de cancelamento
- Booking volume by day or period
- Future booked nights
- Booking pace
These numbers can reveal operational problems a revenue report hides. Suppose revenue is stable, but average length of stay has fallen. You’re now generating the same revenue through more reservations, which means more guest communication, check-ins, cleaning, laundry, and admin work.
A sudden change in booking lead time affects pricing too. If guests book much closer to arrival than usual, your future occupancy may look healthy while leaving you less time to react if demand slows.
How to use it: Look for changes in booking behavior rather than treating each metric as an isolated KPI. A drop in length of stay matters most when it coincides with a rise in booking count and cleaning costs.
4. Income and Expense Report
Performance reporting shows how much business you generated. Income and expense reporting shows what it took to generate it.
A useful report should organize revenue and operating expenses into consistent categories, such as:
- Rental revenue
- Platform and payment processing fees
- Cleaning and laundry
- Serviços públicos
- Supplies
- Manutenção e reparos
- Property management costs
- Software and other operating expenses
How to use it: Review revenue and expenses together. A property generating more revenue isn’t improving if its operating costs are rising even faster. And don’t confuse payout with profit: a payout only tells you money was transferred to you, not how much the property earned after all relevant costs.
Consistent categorization matters more than a long list of categories. If cleaning is recorded as an operating expense one month and omitted or filed differently the next, your month-to-month comparisons become unreliable.
5. Owner Statements
Owner statements matter most for hosts who manage properties for other owners. Unlike an internal performance report, an owner statement answers one question: how did you calculate the amount I’m owed?
A useful statement may include:
- Gross rental revenue
- Platform or booking fees
- Cleaning and other deductions
- Property expenses
- Management fees
- Owner’s share
- Net amount payable
The key is consistency. Owners should be able to understand the calculation and reconcile the final amount with the underlying transactions.
For a single owner managing their own rental, an owner statement may add little. For someone managing multiple properties for different owners, it becomes an important part of financial reporting and communication. A reporting system can automate this by applying the agreed revenue split and generating recurring statements, instead of rebuilding the calculations manually each month.

How to Read Vacation Rental Reports Correctly
Reports are only useful if you know what the numbers mean. The biggest mistake is treating one metric as a verdict on the whole property. Read related metrics together and look for the changes that explain what happened, why, and what to do next.
1. Start With Revenue, Then Work Backward
Begin with the property’s rental revenue, but don’t stop there. A simple sequence is:
Revenue → Bookings → Occupancy & ADR → Channel → Expenses → Net result
This puts each number in context. Revenue may rise because you got more bookings, raised your rates, or simply had more available nights. Those situations need different decisions.
2. Compare Trends, Not Isolated Numbers
A single month’s report rarely tells the whole story. Compare the same metrics across:
- Previous month
- Same month in the previous year
- Upcoming booking period
- Individual properties
- Booking channels
Seasonality makes this essential for vacation rentals. August vs. July may show a change that’s normal for your market, while August vs. the previous August may reveal a real shift.
The same logic applies to expenses. A higher cleaning bill isn’t a problem if you also had far more turnovers. Instead of asking whether total cleaning costs rose, look at cleaning cost per booking or per occupied night. Normalize the data so property size, booking volume, and seasonality don’t distort your conclusions.
3. Read Metrics Together
The most useful insights come from relationships between metrics.
| What you see | What it may indicate | What to investigate |
|---|---|---|
| ADR ↑, Occupancy ↓ | Rates may be reducing demand | Pricing, competitors, minimum stays |
| ADR ↓, Occupancy ↑ | Lower rates may be filling more nights | Whether added volume offsets lower rates |
| Revenue ↑, Profitability ↓ | Costs rising faster than revenue | Fees, cleaning, maintenance, utilities |
| Bookings ↑, Revenue flat | More reservations at lower value | ADR, discounts, length of stay |
| Occupancy ↑, RevPAR ↓ | Inventory or revenue mix may have changed | Rate, availability, blocked nights |
| Revenue ↑, Payout ↑ but margin ↓ | More money in, costs increased | Platform fees, operating expenses |
These patterns are signals, not diagnoses. A change in RevPAR doesn’t tell you by itself whether pricing, demand, availability, or booking mix caused it. Use the related reports to find the explanation.
4. Separate Revenue, Payout, and Profit
These three numbers look similar but answer different questions:
- Revenue is the income generated from bookings under the reporting system’s definition.
- Payout is the amount transferred to you after deductions.
- Profit is what remains after the relevant business expenses are accounted for.
A booking can produce strong revenue but a small payout after platform fees. Even a healthy payout doesn’t mean the property was profitable after cleaning, maintenance, utilities, software, management, and other costs. This is why a reporting system should bring booking and expense data together rather than treating payout as the final measure of performance.
5. Look at Future Performance, Not Just Past Results
Historical reports tell you what already happened. Good operators also use reporting data to see what’s likely to happen next.
Review upcoming occupied nights, available nights, booking pace, average booking value, length of stay, and revenue already on the books. If a property normally has strong demand for an upcoming period but currently has few bookings, you still have time to investigate pricing, minimum-stay rules, availability, or listing performance.
Act while there’s still inventory to sell. A report is far more valuable when it gives you time to change the outcome, rather than just explaining why last month went badly.
How to Consolidate Reports Across Channels
For one property on one platform, manual reporting may be manageable. Add more properties, channels, or direct bookings, and collecting the data becomes its own problem.
Airbnb, Booking.com, Vrbo, and a direct booking site may each present reservations, fees, payouts, and performance differently. Copying numbers into a spreadsheet can create inconsistent definitions, duplicate entries, and reconciliation work.
The goal of consolidation isn’t just to put everything on one screen. The underlying data must use consistent definitions and time periods.
1. Use Consistent Reporting Dimensions
A consolidated report should break down the same metrics by useful dimensions:
| Dimension | What it helps you understand |
|---|---|
| Date | How performance changes over time |
| Propriedade | Which properties perform best |
| Room or unit type | Which inventory generates stronger results |
| Canal | Which booking sources generate revenue |
| Channel account | How individual listings or accounts perform |
| Transaction type | Where revenue, fees, and expenses come from |
Total revenue across ten properties may tell you the business is growing. Breaking it down by property can reveal that two units drive most of the growth while others decline. The same applies to channels: a total revenue figure is useful, but comparing revenue, fees, bookings, and occupancy by channel gives you a much clearer basis for distribution decisions.
2. Keep Stay Dates and Booking Dates Separate
Treating booking date and stay date as the same thing causes major reporting errors. A reservation made in August for an October stay belongs to August when you analyze booking activity, but its revenue belongs to October when you analyze revenue by stay period.
The correct date depends on the question:
- Booking-date reporting: When did guests make reservations?
- Stay-date reporting: When did the stays generate occupancy and revenue?
- Payout-date reporting: When was money actually paid out?
Don’t mix these casually. A report showing August bookings answers a different question from a report showing August stays or August payouts.
3. Reconcile Consolidated Data Before Making Decisions
Before relying on a consolidated report, check whether:
- Reservations are duplicated
- Cancellations and refunds are handled consistently
- Platform fees are included or excluded consistently
- Cleaning fees are classified correctly
- Payouts can be matched to the underlying reservations
- Expenses are assigned to the correct property
- The reporting period uses the intended date
This matters more as your portfolio grows. A small discrepancy that’s easy to spot in one property becomes hard to trace once hundreds of transactions are combined.
A PMS can simplify this by bringing reservations and financial data from connected channels into a common reporting environment. Hostex, for example, provides reporting views that filter by property, channel, and date and lets you export financial data for further reconciliation.
How Often Should You Review Reports?
No single schedule works for every rental. A one-property host doesn’t need the same monitoring as someone managing dozens of units. Match review frequency to how quickly the information can affect your decisions.
The cadence can vary, but the underlying data should come from the same source with the same definitions.
| Frequency | Main focus | Primary question |
|---|---|---|
| Weekly | Performance and future bookings | What needs attention now? |
| Monthly | Revenue, expenses, profitability | How did the business perform? |
| Quarterly | Trends and strategy | What should I change? |
Weekly: Monitor Performance and Upcoming Demand
A weekly review focuses on metrics that can still influence near-term results: occupancy and booked nights, ADR and RevPAR, new bookings and cancellations, channel performance, upcoming occupancy for the next 30 to 60 days, average length of stay, and significant expense changes.
The point isn’t a detailed financial statement every week. It’s catching changes early enough to act. If upcoming occupancy is well below your normal pace, investigate pricing and availability while nights are still available. If bookings arrive faster than expected, you may be able to raise rates instead of continuing to sell at an unnecessarily low price.
Monthly: Review the Full Financial Picture
A monthly review goes deeper: total revenue, revenue by property and channel, occupancy, ADR and RevPAR, platform and payment fees, cleaning and operating expenses, net operating performance, booking and cancellation trends, and owner statements if applicable.
Monthly reporting shows whether revenue growth is translating into better financial performance. It’s also a good time to check that expenses are recorded consistently and to investigate unusual transactions before they accumulate.
Quarterly: Look for Structural Changes
A quarterly review suits decisions that don’t need to be made weekly. Compare properties, channels, and costs over a longer period to spot consistently underperforming properties, channels with weak net results, rising operating costs, and changes in length of stay, lead time, or pricing. This helps distinguish a temporary fluctuation from a recurring problem.
Common Vacation Rental Reporting Mistakes
Even a detailed reporting system produces bad decisions if the data is incomplete or the numbers are interpreted incorrectly. These are the most common mistakes.
1. Treating payouts as profit.
A payout tells you how much money reached your account, not how much the property earned. Track revenue, deductions, and operating expenses separately.
2. Looking at one metric in isolation.
High occupancy can look impressive while ADR is too low; a high ADR can look attractive while too many nights sit vacant. Review occupancy, ADR, and RevPAR together, then connect them with revenue and expense data.
3. Comparing channels with different definitions.
One platform may show gross booking revenue, another host payout, while your direct booking system reports revenue before processing fees. Comparing these directly makes one channel look more or less profitable than it is. Establish consistent definitions before comparing.
4. Mixing booking, stay, and payout dates.
A reservation made in August for a September stay shouldn’t be treated as August revenue when your report measures September stays. Pick the date dimension based on the question and label it clearly.
5. Tracking revenue without tracking costs.
Revenue growth can hide declining margins. A property generating 20% more revenue but 40% more expenses may be moving backward. Review revenue and expenses together, and watch key costs per booking or per occupied night.
6. Ignoring short-stay turnover costs.
Two properties can have similar revenue and occupancy but very different workloads. One filled with longer stays needs fewer cleanings than one producing the same occupied nights through frequent one-night reservations. Track reservation count, average length of stay, and turnover costs together.
7. Relying on manual consolidation too long.
Spreadsheets work for a small portfolio, but repeatedly exporting data from multiple channels and maintaining formulas by hand raises the risk of missing or duplicating information. Automate data collection where practical, and keep a process for checking results against the source systems.
8. Reviewing reports only after problems appear.
A report opened only at tax time or when revenue drops is a historical record, not an operating tool. Establish a regular cadence: weekly to catch demand and booking changes, monthly and quarterly for deeper financial and operational trends.
Perguntas frequentes
What is vacation rental reporting?
Vacation rental reporting involves organizing booking, revenue, expense, and property data into reports that help you evaluate your rental business. It tracks metrics such as occupancy, ADR, and RevPAR, along with revenue by channel, operating expenses, and owner payouts.
Effective reporting helps you understand what happened, why, and what to do next to improve your vacation rental property management.
What reports should a vacation rental owner track?
Most hosts can start with five: occupancy and revenue performance, channel performance, booking and stay patterns, income and expenses, and owner statements if you manage properties for others. The exact set depends on your property, business model, and number of channels.
What is the difference between reporting and accounting?
Reporting helps you understand business performance and decide whether to change pricing or review a channel. Accounting records and manages financial transactions, supporting bookkeeping, reconciliation, financial statements, and tax preparation. A PMS with reporting can support your accounting workflow but doesn’t replace accounting software or professional services.
How often should I review reports?
A practical starting point is weekly for key performance data, monthly for broader financial results, and quarterly for longer-term trends. The right schedule depends on how actively you manage the property and how quickly its performance changes.
What is the difference between ADR and RevPAR?
ADR (Average Daily Rate) is the average rental revenue per booked night: ADR = Rental Revenue ÷ Booked Nights. RevPAR (Revenue per Available Room) is rental revenue per available night: RevPAR = Rental Revenue ÷ Available Nights. ADR excludes unbooked nights; RevPAR includes them, so it better shows how effectively available inventory generates revenue.
Do I need accounting software if I already have reports?
Possibly. A PMS report gives a clear view of bookings, revenue, expenses, and performance, while accounting software may be needed for bookkeeping, reconciliation, financial statements, or tax processes. Whether you need separate software depends on your business structure, jurisdiction, transaction volume, and accountant’s requirements.
Can reporting be automated?
Yes. Many PMS platforms consolidate reservation and financial data from connected channels and generate recurring reports automatically. This reduces manual entry, but automated reports should still be checked periodically for missing reservations, duplicate data, incorrect categorization, cancellations, refunds, and reconciliation differences. The goal is to eliminate repetitive data preparation, not oversight.

 Portuguese
  English
  Japanese
  Spanish
  Arabic
  French
  Russian
  German
  Korean
  Italian
  Thai
Thai